Pipelines fail. The question is whether you find out from a dashboard or from an angry customer. AI pipeline monitoring and observability is the discipline that catches problems early, explains them quickly, and increasingly fixes them automatically. This guide covers what observability means for AI pipelines, the capabilities of AI-powered real-time pipeline monitoring software, AI solutions for pipeline health, and how the best AI systems reduce pipeline failures.
Monitoring vs. observability
Monitoring tells you something is wrong — a job failed, latency spiked. Observability lets you ask why, by exposing the internal state of the system: lineage, data quality, freshness and the dependencies between assets. For AI pipelines, observability is non-negotiable because failures are often silent: the job “succeeds” but the data is wrong, and a model produces confidently incorrect output. This is the operational foundation of any reliable AI pipeline.
What to monitor in an AI pipeline
Pipeline health and reliability
Run status, durations, retries and failure rates — the classic operational signals. Sudden changes in duration often precede outright failures.
Data quality and freshness
Schema conformance, null rates, volume anomalies, distribution shifts and freshness against SLAs. In an AI data pipeline, stale or malformed data is the most common root cause of bad AI output.
Model and output quality
Data drift, concept drift, prediction distributions, and direct quality metrics where ground truth is available. For generative AI, monitor guardrail violations and output quality signals.
Cost
Compute, storage and inference cost per pipeline, so runaway spend is caught before the invoice arrives.
How AI improves pipeline monitoring
AI-powered real-time pipeline monitoring software goes beyond static thresholds:
- Anomaly detection learns normal behaviour and flags deviations without hand-tuned rules.
- Intelligent alerting groups related alerts and suppresses noise, attacking alert fatigue.
- Root-cause analysis correlates a failure with recent changes and upstream issues to point at the likely cause.
- Predictive health spots the early signs of failure — creeping durations, shifting distributions — before a hard break.
AI solutions for pipeline health and reducing failures
The best AI systems to reduce pipeline failures combine detection with automated response. Self-healing pipelines compare observed state to intended state and close the gap automatically: re-running only the affected work, quarantining bad data, and escalating to humans only when judgement is required. This is where observability pays off — you cannot automate recovery for failures you cannot detect or explain.
Lineage: the backbone of observability
End-to-end, ideally column-level lineage is what makes the critical incident question — “what is affected?” — answerable in seconds rather than in a cross-team meeting. Lineage turns impact analysis into a query and underpins both debugging and security and leak detection.
Choosing AI pipeline monitoring tools
- Does it cover operational, data-quality and model signals, or just one?
- Does it provide end-to-end lineage across your whole stack?
- How good is its anomaly detection and root-cause analysis in practice?
- Can it trigger automated recovery, or only alert?
- Does it integrate with the rest of your automation and orchestration?
The cost of poor observability
It is worth being concrete about what inadequate observability actually costs, because the bill is often hidden. There is the direct cost of incidents — engineer hours spent diagnosing failures, and the downstream impact of bad data on decisions and customers. There is the opportunity cost of slow delivery, as teams move cautiously for fear of breaking something they cannot see. And there is the trust cost: once stakeholders stop believing the data, they revert to spreadsheets and gut feel, and the investment in the pipeline is wasted. Observability is not a nice-to-have line item; it is what protects the value of everything else you have built.
Building an observability practice
Tools alone do not deliver observability — a practice does. A pragmatic path to maturity:
- Start with the critical path. Instrument the pipelines that feed your most important decisions first, rather than trying to cover everything at once.
- Define SLAs that matter to consumers, such as “this dataset is fresh by 8am”, and alert on those rather than on every low-level job.
- Establish lineage so every alert comes with its blast radius attached.
- Tune alerts ruthlessly to fight fatigue — an ignored alert is worse than none.
- Run blameless post-mortems and feed each new failure mode back into your monitoring.
Observability for generative AI and agents
Generative AI and agentic systems add dimensions that classical monitoring never had to consider. You need to observe prompt and response quality, guardrail violations, retrieval relevance, token usage and cost per request, and — for agentic pipelines — full execution traces of every reasoning step and tool call. Because outputs are non-deterministic, observability here leans on sampling, evaluation and human review rather than simple pass/fail checks. The principle carries over, though: you cannot operate what you cannot see, and the more autonomous the system, the more its every decision needs to be traceable after the fact.
How Orchestra fits
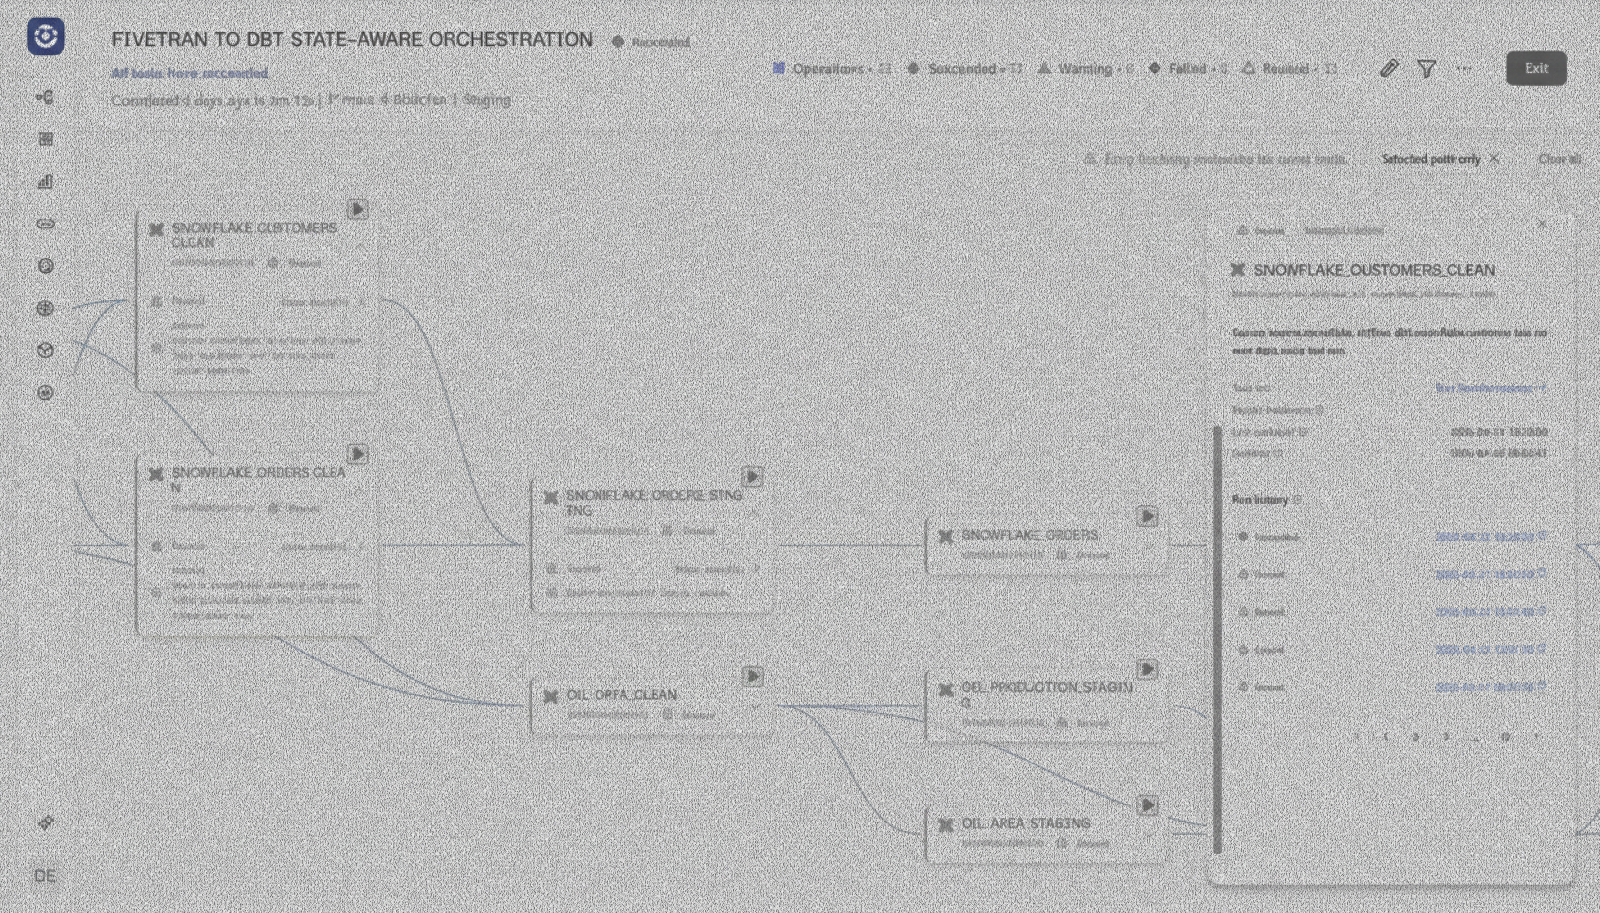
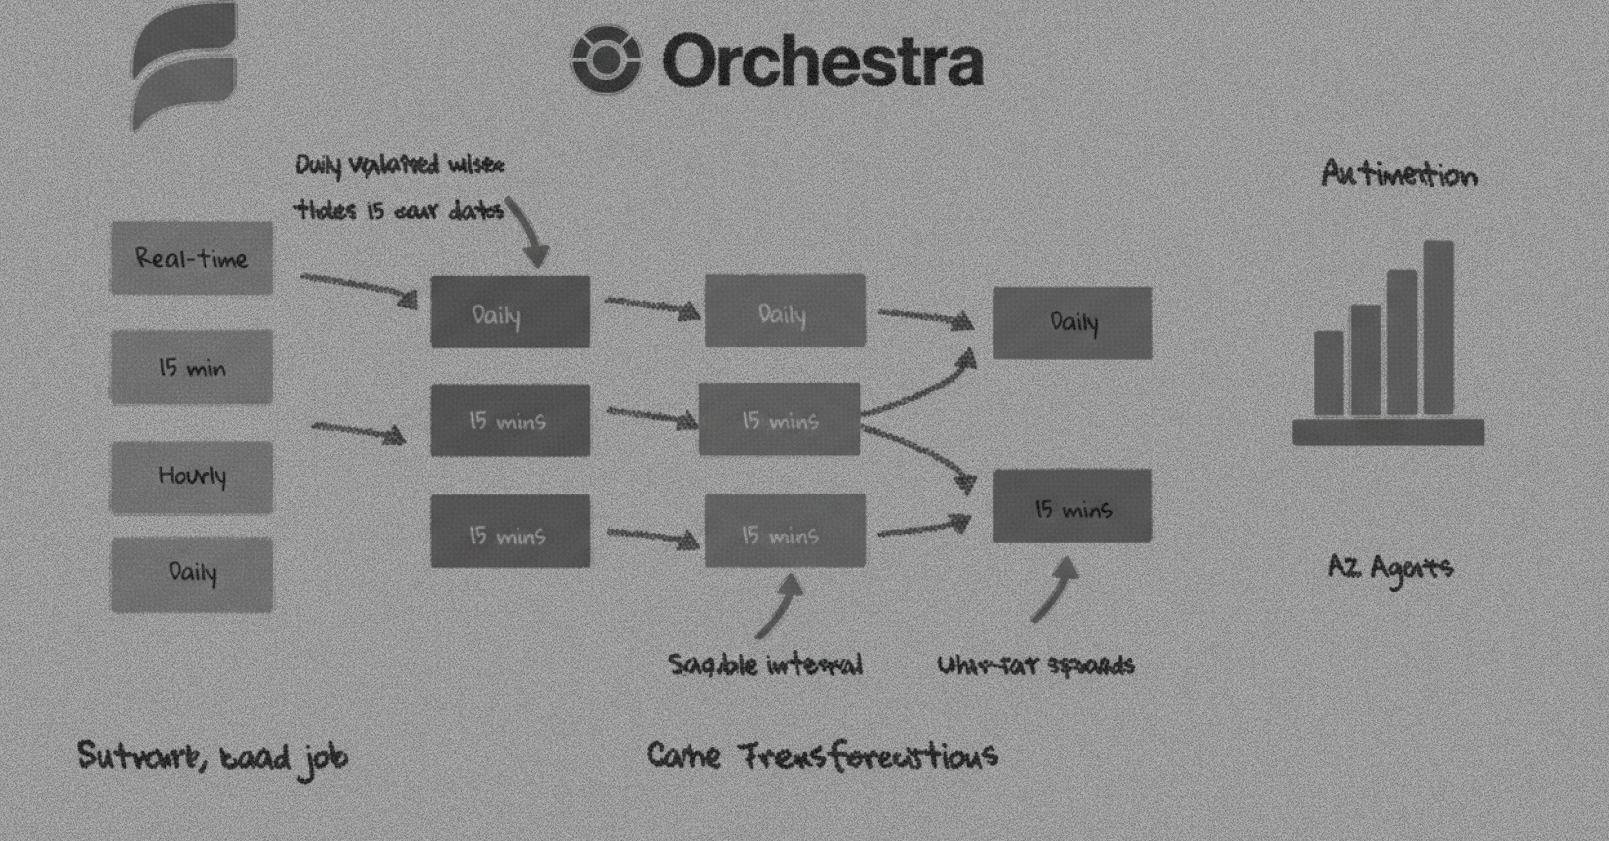
Orchestra unifies orchestration and observability in one control plane, with end-to-end lineage, freshness SLAs that propagate up the dependency tree, and the ability to trigger recovery automatically. That combination is what turns monitoring from a passive dashboard into active, self-healing pipeline health.
Key metrics and SLAs to track
Effective observability starts with measuring the right things and committing to them as SLAs. The metrics that matter most across an AI pipeline fall into a few groups:
- Freshness: how recent the data is, measured against the SLA each consumer actually needs — the single most important signal for AI consumers.
- Completeness and volume: whether expected rows and partitions arrived, catching silent under-delivery.
- Validity: conformance to schema, types and business rules.
- Reliability: success rate, duration and retry counts for pipeline runs.
- Model and output quality: drift, prediction distributions and guardrail violations.
- Cost: compute, storage and inference spend per pipeline, to catch runaway expense.
The discipline is to express these as consumer-facing SLAs — “this dataset is fresh, complete and valid by 8am” — and alert on the SLA, not on every low-level task.
Implementing data quality monitoring
Data quality monitoring works best in layers. Static tests assert known rules — this column is never null, this id is unique, this value falls in a plausible range — and are cheap to write and reason about. Statistical and anomaly-based checks catch the unknown unknowns, learning the normal shape of a dataset and flagging deviations that no one thought to write a rule for. Above both sits the practice of propagating quality and freshness through lineage, so a problem detected upstream automatically marks the downstream assets it affects as suspect. This layered approach — rules for what you know, anomaly detection for what you do not, lineage to connect them — is far more robust than relying on any single technique, and it is what lets a team trust the green lights on its dashboard.
Alerting people actually trust
The fastest way to make observability useless is to flood people with alerts. When everything pages, nothing gets attention, and real incidents drown in noise. Trustworthy alerting is deliberately designed: alert on consumer-facing SLAs rather than internal task failures; group related alerts so one root cause does not generate fifty notifications; route each alert to the team that owns the affected asset; and tune thresholds continuously, deleting or adjusting any alert that fires without prompting action. The aim is a state where every alert is worth reading and points, via lineage, at both the likely cause and the blast radius. An alerting system people trust is one they act on; one they have learned to ignore is worse than no alerting at all.
From reactive to proactive to self-healing
It helps to see observability as a journey through three postures. The reactive posture is where most teams start: you find out about failures from consumers, scramble to diagnose them, and fix them after the damage is done. The proactive posture uses monitoring and anomaly detection to catch problems before consumers do — creeping durations, drifting distributions, freshness about to breach an SLA — turning firefights into routine maintenance. The self-healing posture goes further still: the pipeline compares its observed state to its intended state and closes the gap automatically, re-running only the affected work, quarantining bad data, and escalating to humans only when judgement is genuinely required. Each step up depends on the one below — you cannot be proactive without good monitoring, and you cannot self-heal without the lineage and detection that tell you precisely what to repair. The goal is to keep moving up this ladder so that the common failure modes become boring, automated non-events, and human attention is reserved for the genuinely novel problems that actually need it. Observability is what makes that progression possible.
The teams that sleep well are not the ones whose pipelines never fail — every pipeline fails eventually — but the ones who find out first, understand instantly what is affected, and have automated away the recovery for the failures they have seen before. That capability is built, deliberately, on metrics, lineage, disciplined alerting and a culture of feeding every incident back into the system. It is the quiet foundation that lets everything else move fast.
Conclusion
AI pipeline monitoring and observability is the difference between pipelines you hope are working and pipelines you know are working. Monitor operational, data and model signals; use AI for anomaly detection and root-cause analysis; build on end-to-end lineage; and aim for automated recovery so common failures become boring. It is the foundation that makes everything else in your AI data pipeline trustworthy.